The author discusses using Python, network science, and geospatial data to answer the question of whether all roads lead to Rome. They load and visualize the Roman road network data using GeoPandas and Matplotlib. They transform the road network into a graph object using the OSMNx package. They then visualize the network using Gephi. Next, they calculate network centralities such as node degree and betweenness centrality. Finally, they map the road network nodes into hexagons and analyze the centrality scores within each hexagon. The conclusion is that Rome is a central hub in the road network.
Quantifying the Ancient Question with Python, Network Science, and Geospatial Data
In this article, the author discusses their project of quantifying the importance of Rome in the road network of the Roman Empire. They use Python, network science, and geospatial data to analyze and visualize the road network.
1. Read and visualize the data
The author uses GeoPandas and Matplotlib libraries in Python to load and explore the Roman road network data. They load the dataset and visualize it using a map.
2. Transform the road network into a Graph object
To analyze the road network, the author transforms the line polygons of the roads into a graph using the OSMNx package. They create an edge table and a node table from the original dataset and build the graph using NetworkX.
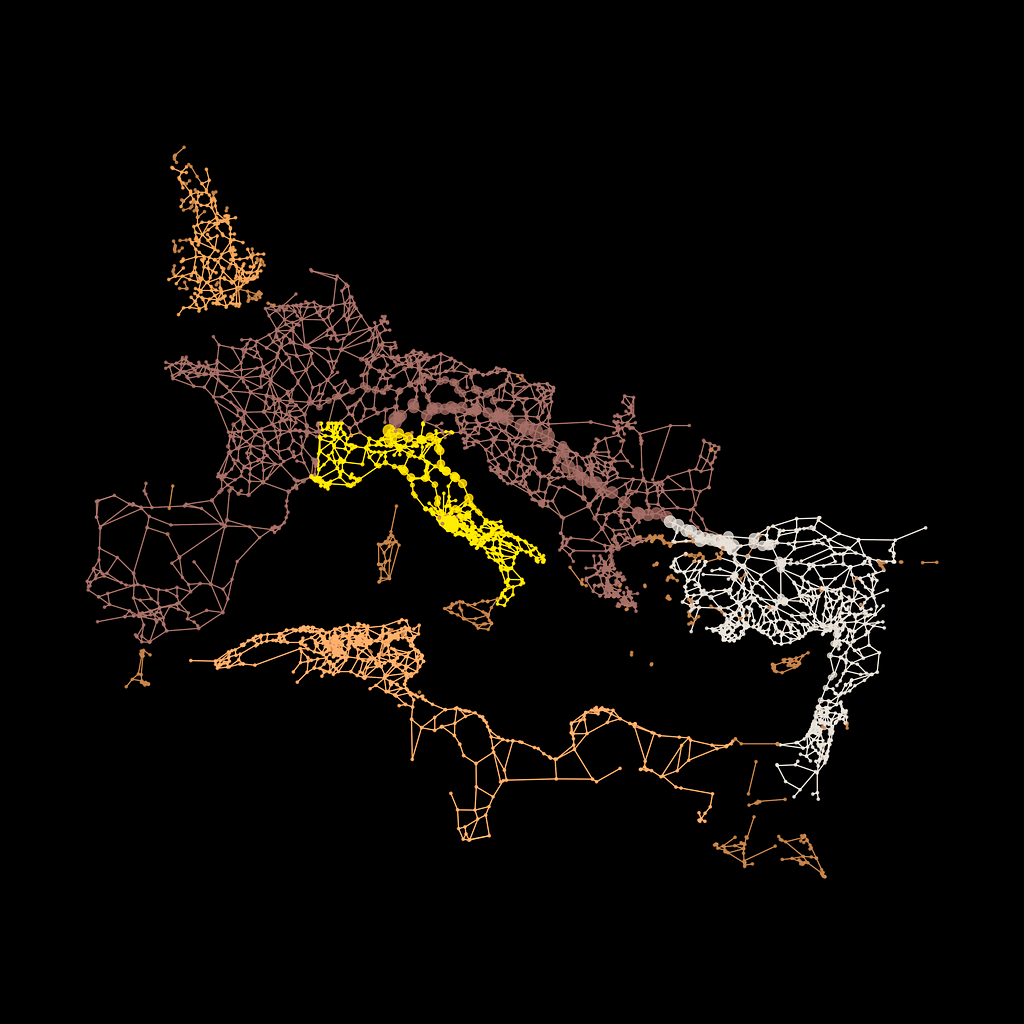
3. Visualizing the network in Gephi
The author visualizes the road network using Gephi, a software that offers more flexibility and better visual-fine-tuning options. They transform the graph into a Gephi-compatible file and export it.
4. Network centralities
The author computes the total degree and unnormalized betweenness centrality of each node in the graph to quantify their importance. They have the importance scores of each crossing and the location of each node.
5. Mapping nodes to the admin boundaries of Rome
The author maps the road network nodes to the admin boundaries of Rome using OSMNx. They create hexagon grids to group the nodes and intersections belonging to Rome. They compute the aggregated importance of each hexagon based on the centrality scores of the enclosed network nodes.
6. Visualizing the network in hexagon grids
The author visualizes the hexagon grid of the Roman Empire and colors each hexagon based on the total degree and betweenness centrality of the enclosed road network nodes. They compare the results with the polygon of Rome and conclude that Rome dominates in terms of centrality.
The article concludes by highlighting the practical applications of AI in business and suggesting the AI Sales Bot from itinai.com as a solution for automating customer engagement and managing interactions across all customer journey stages.
List of Useful Links:
- AI Lab in Telegram @aiscrumbot – free consultation
- Do All the Roads Lead to Rome?
- Towards Data Science – Medium
- Twitter – @itinaicom