Introduction
This tutorial outlines a straightforward method to use Cloudflared, a tool by Cloudflare, to create a secure, publicly accessible link to your Streamlit app. By the end, you will have a fully functional cryptocurrency dashboard that dynamically scrapes and visualizes real-time price data from CoinMarketCap. This dashboard allows you to track the top 10 cryptocurrencies, compare their prices and market capitalizations, and view interactive charts for enhanced insights.
Installation of Dependencies
To begin, install the necessary dependencies for building and deploying your Streamlit-based cryptocurrency dashboard. Use the following commands:
    !pip install streamlit requests beautifulsoup4 pandas matplotlib plotly
    !npm install -g localtunnel
The first command installs essential Python libraries: Streamlit for the web app, BeautifulSoup4 for web scraping, Pandas for data manipulation, and Plotly for interactive visualizations. The second command installs LocalTunnel, which creates a public URL for accessing the Streamlit app from Google Colab.
Building the Streamlit Application
Next, create the Streamlit application to scrape cryptocurrency prices:
    %%writefile app.py
    import streamlit as st
    import requests
    from bs4 import BeautifulSoup
    import pandas as pd
    import plotly.express as px

    def scrape_crypto_prices():
        url = "https://coinmarketcap.com/"
        headers = {"User-Agent": "Mozilla/5.0"}
        response = requests.get(url, headers=headers)

        if response.status_code != 200:
            return pd.DataFrame(), "Error fetching data."

        soup = BeautifulSoup(response.text, "html.parser")
        rows = soup.select("tbody tr")[:10]

        data = []
        for row in rows:
            columns = row.find_all("td")
            name = columns[2].find("p").text
            symbol = columns[2].find("p", class_="coin-item-symbol").text
            price = columns[3].text
            change = columns[4].text
            market_cap = columns[6].text
            data.append([name, symbol, price, change, market_cap])

        return pd.DataFrame(data, columns=["Name", "Symbol", "Price", "% Change", "Market Cap"]), None

    st.title("Cryptocurrency Dashboard")
This code defines a Streamlit web application that scrapes real-time cryptocurrency prices from CoinMarketCap and displays them in an interactive dashboard. It uses BeautifulSoup4 to extract the top 10 cryptocurrencies, including their name, symbol, price, percentage change, and market capitalization. The data is processed using Pandas and visualized with Plotly, presenting a bar chart for price comparison and a pie chart for market capitalization distribution. An error message will display if there is an issue fetching the data.
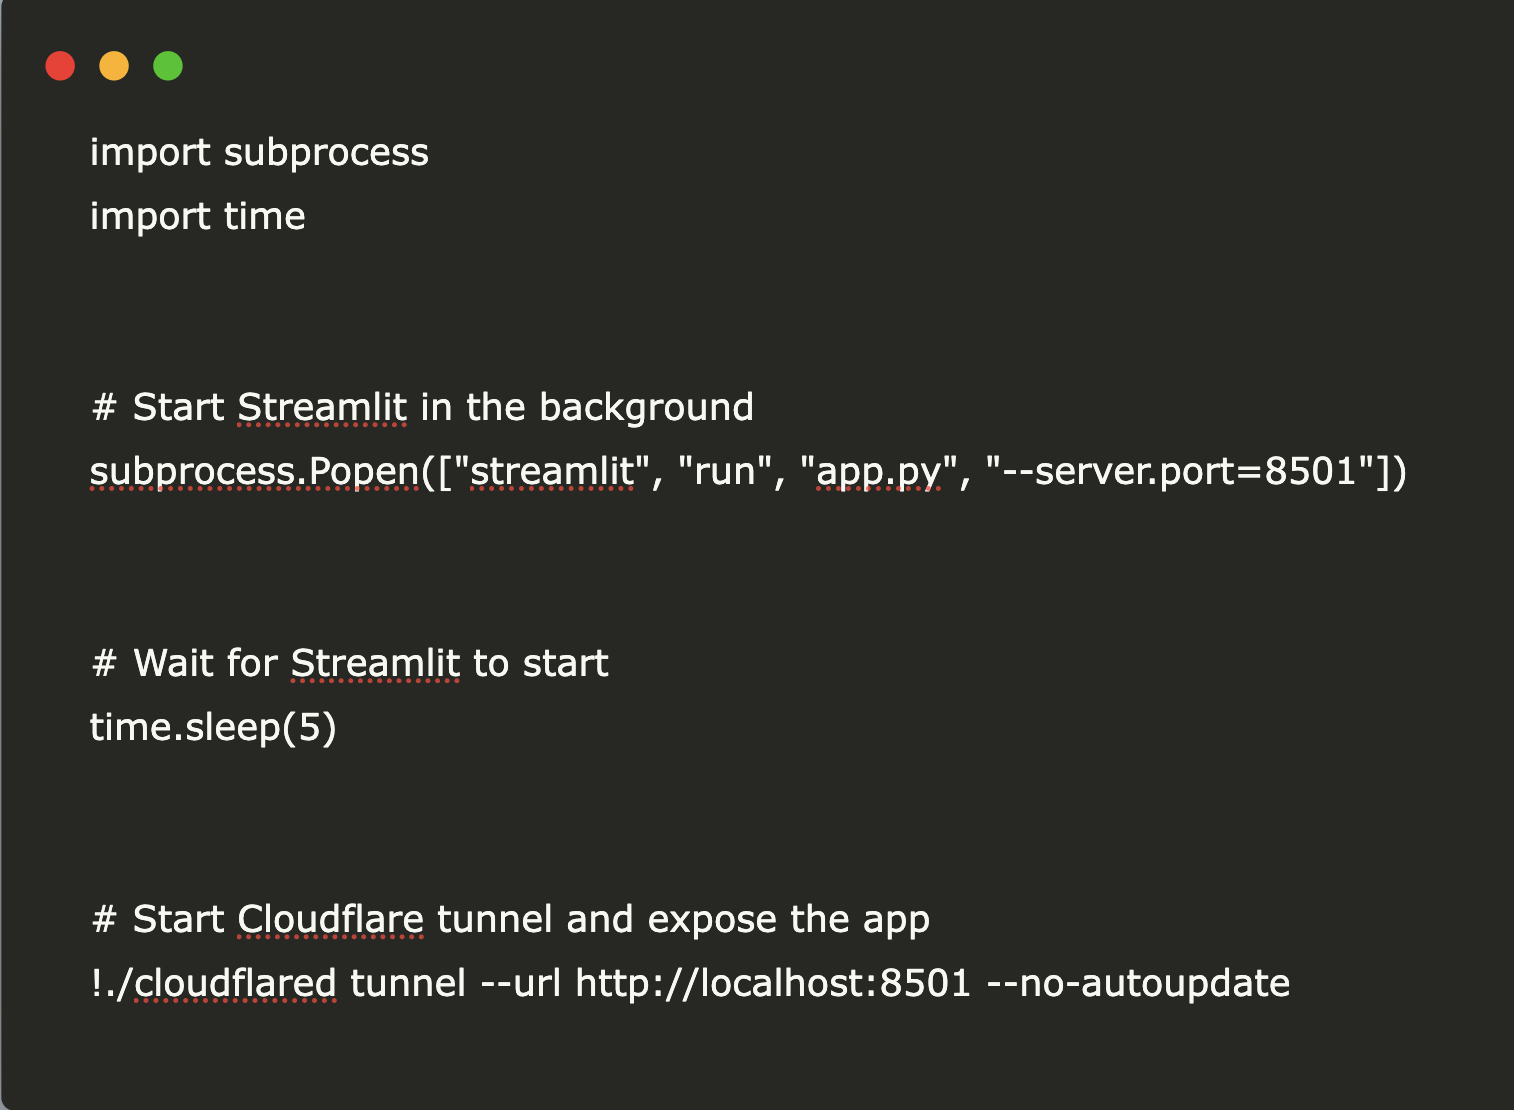
Launching the Application
To launch the Streamlit app and create a public URL, use the following code:
    import subprocess
    import time

    subprocess.Popen(["streamlit", "run", "app.py", "--server.port=8501"])
    time.sleep(5)
    !./cloudflared tunnel --url http://localhost:8501 --no-autoupdate
This code runs the Streamlit app in the background and allows it to operate on port 8501. A brief delay ensures the app initializes properly before starting the Cloudflared tunnel, which generates a public URL for accessing the app from Google Colab without authentication or additional setup.
Conclusion
This tutorial provided a step-by-step guide to building and deploying a real-time cryptocurrency tracking app using Streamlit, BeautifulSoup, Pandas, and Plotly. We successfully scraped live crypto data from CoinMarketCap, displayed it in an interactive dashboard, and hosted it seamlessly using Cloudflared. This approach simplifies deployment without authentication hassles, making it suitable for beginners and developers alike.
Next Steps
Explore how artificial intelligence can enhance your business processes. Identify areas where automation can add value, select appropriate tools, and start with small projects to measure effectiveness. For guidance on managing AI in business, contact us at hello@itinai.ru or connect with us on Telegram, X, and LinkedIn.