This text discusses a method for segmenting product features into Core, Power, and Casual categories based on retention rates. The author emphasizes the importance of considering both the qualitative (value) and quantitative (popularity) metrics when analyzing feature retention. By applying percentile thresholds, the author identifies nine clusters of product features and provides insights on each cluster. The author also highlights the significance of Niche features with high retention rates and suggests improving their adoption. Additionally, the author discusses the distribution of features across different clusters and provides cluster statistics.

A Simple and Powerful Approach to Segmenting Product Features
In this post, we will discuss a straightforward method for segmenting your product features into Core, Power, and Casual categories based on their impact on product retention.
Understanding Product Retention
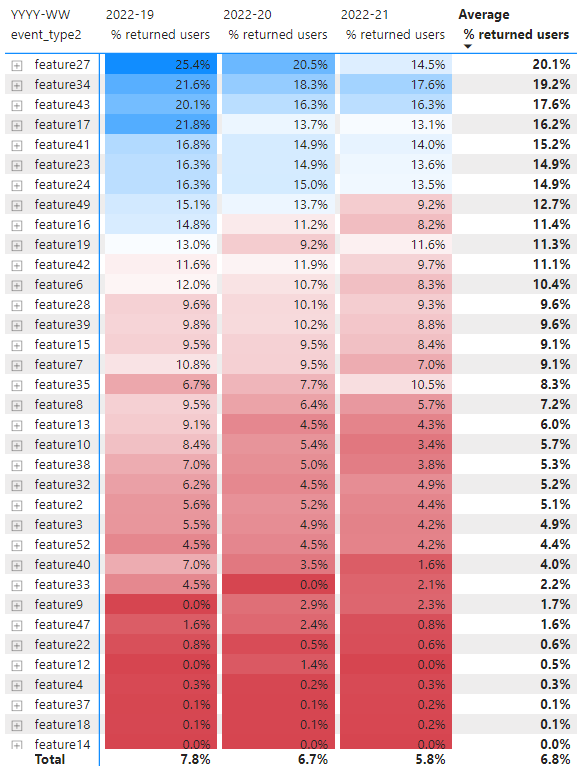
Before we dive into the segmentation process, let’s review how we measure product retention. By analyzing user data, we can determine which features are most influential in keeping users engaged with our product.
However, it’s important to consider both the qualitative and quantitative aspects of this analysis. While we may identify features with high retention rates, we need to ensure that these figures are reliable by also considering the number of users who actually used these features.
Combining Quantity and Quality Metrics
To address this issue, we can combine both qualitative and quantitative metrics into a scatter plot. The x-axis represents the popularity of a product feature (measured by the percentage of users who used it), and the y-axis represents the value of the feature (measured by the percentage of users who returned to use it).
This scatter plot allows us to visualize the relationship between popularity and value for each feature.
Improving Chart Clarity
To enhance the clarity of the scatter plot, we can apply the 50/80 percentile rule. By setting thresholds for both popularity and value metrics, we can divide the features into different clusters.
These clusters include:
- Core: Features with high popularity and value
- Power: Features with high popularity but lower value
- Casual: Features with moderate popularity and value
- Set-up: Features used during product setup
- Niche: Features with limited popularity but high value
- Others: Features that don’t fit into the above categories
Understanding the Clusters
Core features are the essential components of your product that are widely used and bring users back for more. Power features are the workhorses that, combined with core features, deliver most of the product’s value. Casual features are less frequently used but still provide some value.
Set-up features are used during the initial onboarding phase, while niche features offer significant value to a limited number of users. The “others” category includes features that don’t fit into any specific cluster.
Comparing Results
By using this balanced approach that considers both quality and quantity metrics, we can gain valuable insights into the different clusters of product features. We can identify niche features with high retention and explore ways to increase their adoption.
It’s important to note that features may move between clusters over time due to various factors like user acquisition efforts, UX changes, or user base maturation.
Key Insights
From our analysis, we found that core and power features account for only a small percentage of all product features. The “others” cluster has a significant number of features but serves only a small portion of users. Niche features, despite their limited popularity, have the highest retention.
Using AI to Evolve Your Company
If you want to leverage AI to stay competitive and redefine your way of work, consider the AI solutions offered by itinai.com. They provide automation opportunities, help define measurable KPIs, offer customizable tools, and guide you through a gradual implementation process.
Connect with itinai.com at hello@itinai.com for AI KPI management advice and stay updated on AI insights through their Telegram channel t.me/itinainews or Twitter @itinaicom.
Spotlight on a Practical AI Solution: AI Sales Bot
Explore the AI Sales Bot from itinai.com/aisalesbot, designed to automate customer engagement and manage interactions throughout the customer journey. Discover how AI can redefine your sales processes and customer engagement.
List of Useful Links:
- AI Lab in Telegram @aiscrumbot – free consultation
- An enhanced version of the analysis of how product features impact retention
- Towards Data Science – Medium
- Twitter – @itinaicom


