Building an Advanced Financial Data Reporting Tool
In this tutorial, we will guide you through creating a financial data reporting tool using Google Colab and various Python libraries. You will learn to:
- Scrape live financial data from web pages
- Retrieve historical stock data using yfinance
- Visualize trends with matplotlib
- Integrate an interactive user interface with ipywidgets
- Generate dynamic PDF reports using FPDF
Step 1: Install Required Libraries
Begin by installing the necessary libraries:
!pip install fpdf beautifulsoup4 yfinance ipywidgetsStep 2: Import Libraries
Import the libraries needed for building the financial data tool:
import requests
from bs4 import BeautifulSoup
from fpdf import FPDF
import yfinance as yf
import matplotlib.pyplot as plt
import ipywidgets as widgets
from IPython.display import display, FileLink
Step 3: Generate Financial Report
The following function generates a financial report based on user inputs:
def generate_report(b):
    symbol = symbol_text.value.upper().strip()
    start_date = start_date_picker.value
    end_date = end_date_picker.value

    output_area.clear_output()

    if not (symbol and start_date and end_date):
        with output_area:
            print("Please provide valid inputs for stock symbol and both dates.")
        return

    with output_area:
        print(f"Generating report for {symbol} from {start_date} to {end_date}...")

    try:
        stock = yf.Ticker(symbol)
        current_price = stock.info.get('regularMarketPrice', 'N/A')
    except Exception as e:
        current_price = "Error retrieving price"
        with output_area:
            print("Error retrieving current price:", e)

    try:
        hist = stock.history(start=start_date, end=end_date)
    except Exception as e:
        hist = None
        with output_area:
            print("Error fetching historical data:", e)

    if hist is not None and not hist.empty:
        plt.figure(figsize=(10, 5))
        plt.plot(hist.index, hist['Close'], marker='o', linestyle='-', label="Close Price")
        plt.title(f"{symbol} Historical Closing Prices")
        plt.xlabel("Date")
        plt.ylabel("Close Price (USD)")
        plt.grid(True)
        plt.xticks(rotation=45)
        plt.tight_layout()
        graph_filename = "graph.png"
        plt.savefig(graph_filename)
        plt.show()
    else:
        graph_filename = None
        with output_area:
            print("No historical data available for the selected date range.")

    pdf = FPDF()
    pdf.add_page()
    pdf.set_font("Arial", "B", 16)
    pdf.cell(0, 10, f"Financial Report for {symbol}", ln=True, align="C")
    pdf.ln(10)

    pdf.set_font("Arial", size=12)
    pdf.cell(0, 10, f"Current Price: {current_price}", ln=True)
    pdf.cell(0, 10, f"Date Range: {start_date} to {end_date}", ln=True)
    pdf.ln(10)

    if graph_filename:
        pdf.cell(0, 10, "Historical Closing Prices:", ln=True)
        pdf.image(graph_filename, w=180)

    pdf_filename = "financial_report.pdf"
    pdf.output(pdf_filename)

    with output_area:
        print(f"PDF Report generated: {pdf_filename}")
        display(FileLink(pdf_filename))
Step 4: Create User Interface
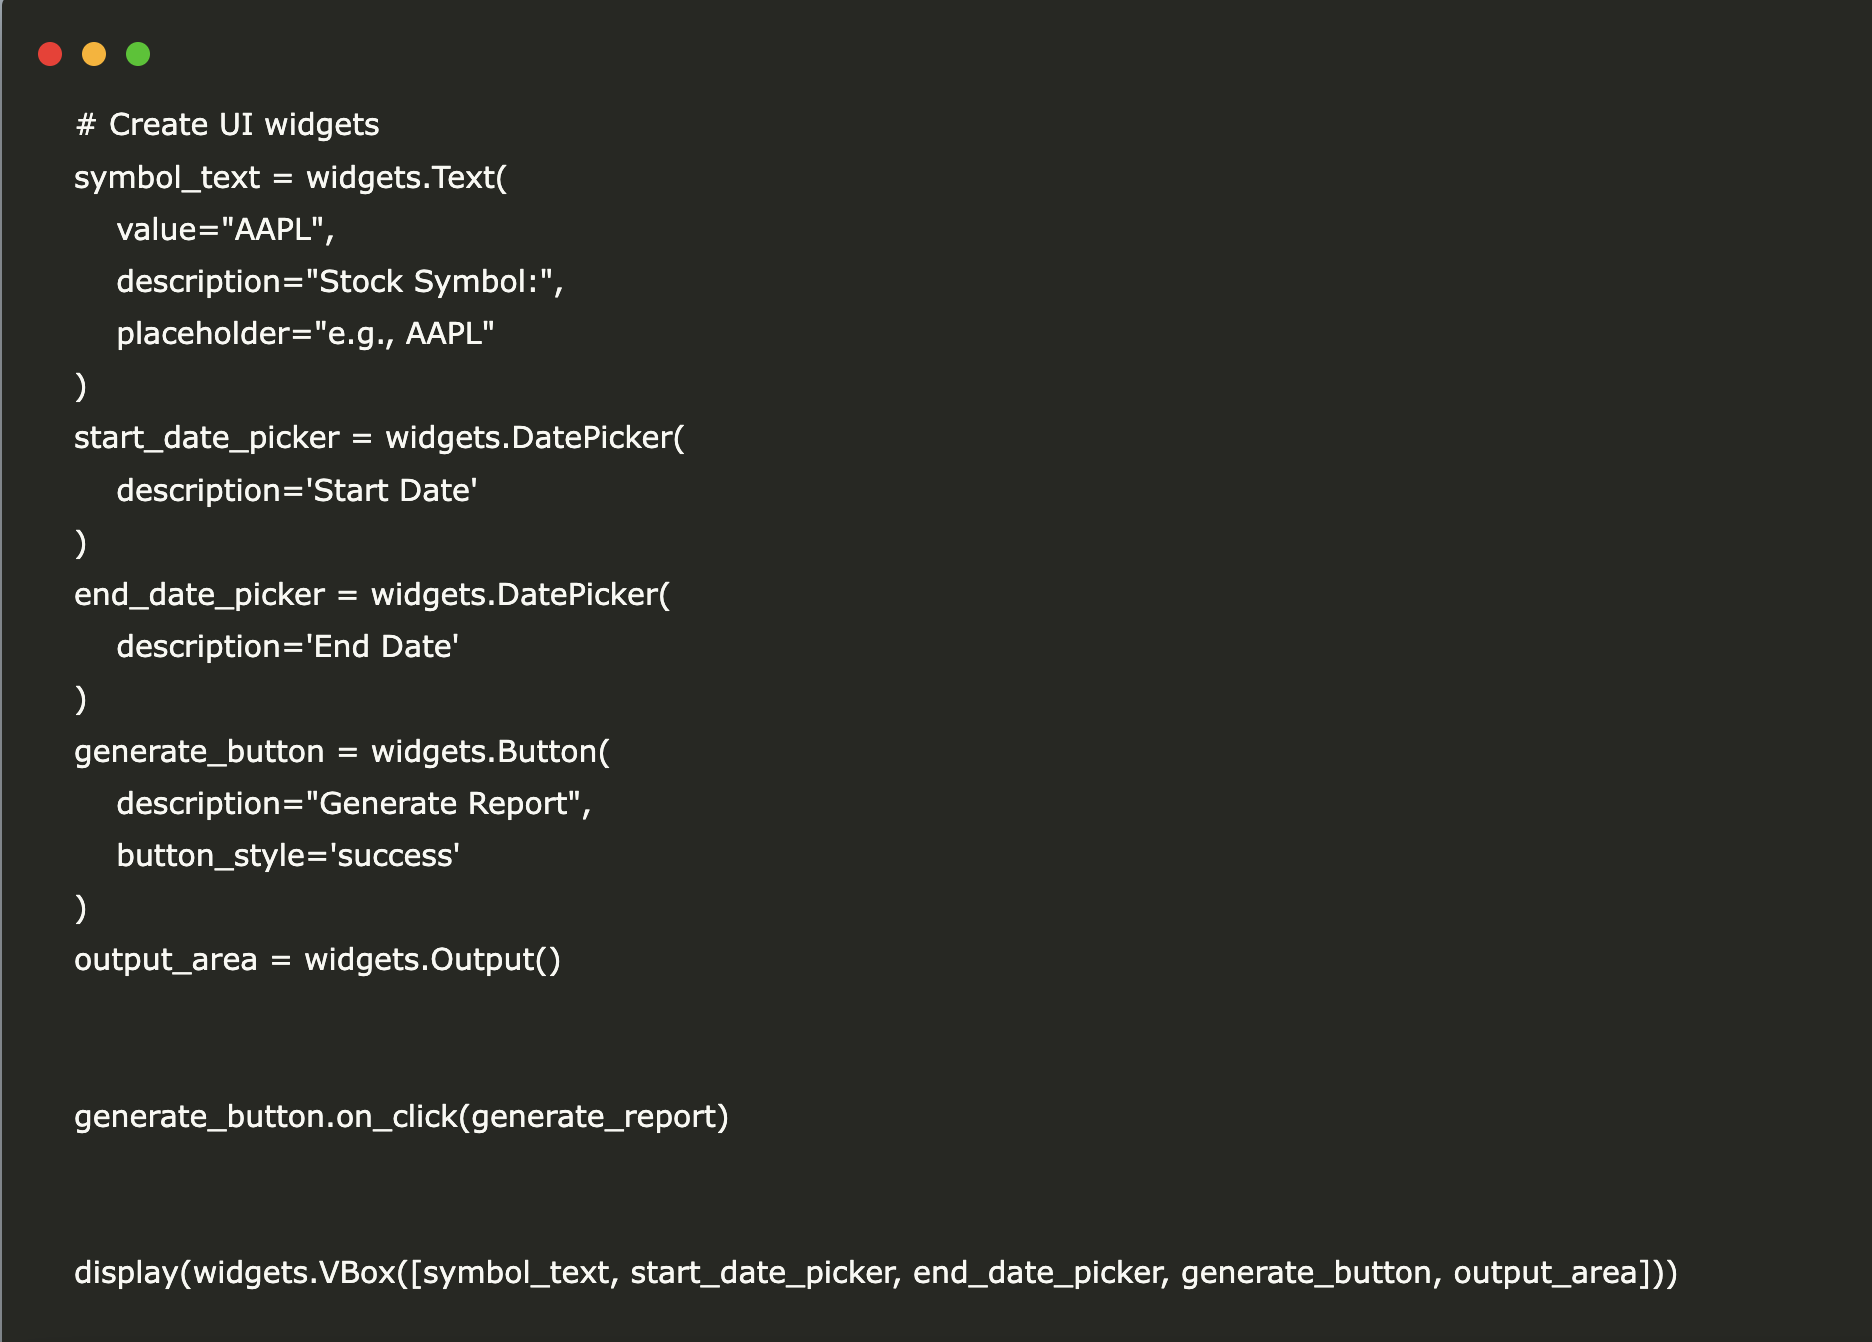
Set up an interactive user interface using ipywidgets:
symbol_text = widgets.Text(
    value="AAPL",
    description="Stock Symbol:",
    placeholder="e.g., AAPL"
)
start_date_picker = widgets.DatePicker(
    description='Start Date'
)
end_date_picker = widgets.DatePicker(
    description='End Date'
)
generate_button = widgets.Button(
    description="Generate Report",
    button_style='success'
)
output_area = widgets.Output()

generate_button.on_click(generate_report)

display(widgets.VBox([symbol_text, start_date_picker, end_date_picker, generate_button, output_area]))
Conclusion
By following this tutorial, you have successfully integrated web scraping, data analysis, interactive UI design, and PDF report generation into a single Google Colab notebook. This process demonstrates how to utilize Python’s libraries to create a user-friendly financial data tool.
For further assistance or inquiries about managing AI in business, please contact us at hello@itinai.ru.
“`