The text is a detailed tutorial on creating zoom plots using Matplotlib. The author outlines a step-by-step process, from fetching and preparing data to creating the zoom plots with magnified views of areas of interest. The tutorial also includes code snippets and explanations for each step. This approach promises clear and informative visualizations for complex data.
“`html
Make beautiful multi-scale plots with matplotlib in 3 easy steps
Step 0: Get Data
Fetch the rain gauge records via the Open Science Framework.
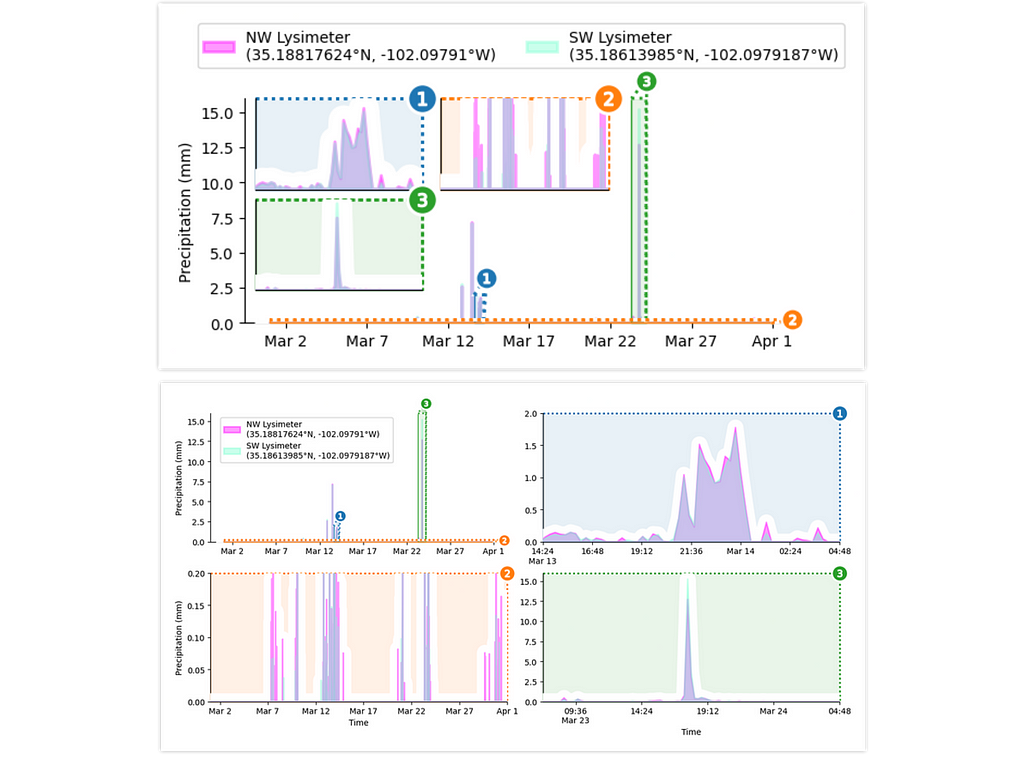
df = pd.read_csv("https://osf.io/6mx3e/download") # download dataStep 1: Axes Grid
Our first plotting step is to initialize an outset.OutsetGrid instance to manage our lattice of magnification plots.
grid = otst.OutsetGrid(
    data=[
        (71.6, 0, 72.2, 2),
        (59, 0, 90, 0.2),
        (81.3, 0, 82.2, 16),
    ],
    x="Time",
    y="Precipitation (mm)",
    aspect=2,
    col_wrap=2,
    marqueeplot_kws={"frame_outer_pad": 0, "mark_glyph_kws": {"zorder": 11}},
    marqueeplot_source_kws={"zorder": 10, "frame_face_kws": {"zorder": 10}},
)
Step 2: Plot Content
It’s time to put some content on our axes.
for y, color in zip([nwls, swls], ["fuchsia", "aquamarine"]):
    grid.broadcast(
        plt.stackplot,
        march_df["Decimal DOY"],
        march_df[y],
        colors=[color],
        labels=[y],
        lw=2,
        edgecolor=color,
        alpha=0.4,
        zorder=10,
    )
Step 3: Zoom Indicators
Now it’s time to add zoom indicator boxes, a.k.a. outset “marquees,” to show how the scales of our auxiliary plots relate to the scale of the main plot.
grid.marqueeplot(equalize_aspect=False)Our last business is to add a legend and switch out numeric x ticks for proper timestamps.
grid.source_axes.legend(
    loc="upper left",
    bbox_to_anchor=(0.02, 1.0),
    frameon=True,
)
Bonus: Want Insets Instead?
We can create insets by rearranging the magnification lattice axes into position over the main axes.
otst.inset_outsets(
    grid,
    insets=otst_util.layout_corner_insets(
        3,
        "NW",
        inset_margin_size=(0.02, 0),
        inset_grid_size=(0.67, 0.9),
    ),
    equalize_aspect=False,
)
sns.move_legend(
    grid.source_axes, "lower center", bbox_to_anchor=(0.5, 1.1), ncol=2
)
Further Information
You can learn more about using outset in the library’s documentation at https://mmore500.com/outset. In particular, be sure to check out the quickstart guide.
Outset can be installed via pip as python3 -m pip install outset.
Authorship
This tutorial is contributed by me, Matthew Andres Moreno.
Citations
Evett, Steven R.; Marek, Gary W.; Copeland, Karen S.; Howell, Terry A. Sr.; Colaizzi, Paul D.; Brauer, David K.; Ruthardt, Brice B. (2023). Evapotranspiration, Irrigation, Dew/frost — Water Balance Data for The Bushland, Texas Soybean Datasets. Ag Data Commons. https://doi.org/10.15482/USDA.ADC/1528713. Accessed 2023–12–26.
J. D. Hunter, “Matplotlib: A 2D Graphics Environment”, Computing in Science & Engineering, vol. 9, no. 3, pp. 90–95, 2007. https://doi.org/10.1109/MCSE.2007.55
Marek, G. W., Evett, S. R., Colaizzi, P. D., & Brauer, D. K. (2021). Preliminary crop coefficients for late planted short-season soybean: Texas High Plains. Agrosystems, Geosciences & Environment, 4(2). https://doi.org/10.1002/agg2.20177
Data structures for statistical computing in python, McKinney, Proceedings of the 9th Python in Science Conference, Volume 445, 2010. https://doi.org/10.25080/Majora-92bf1922-00a
Waskom, M. L., (2021). seaborn: statistical data visualization. Journal of Open Source Software, 6(60), 3021, https://doi.org/10.21105/joss.03021.
Appendix
You can find the entire code as a gist here and as a notebook here.
To install dependencies for this exercise,
python3 -m pip install
    matplotlib `# ==3.8.2`
    numpy `# ==1.26.2`
    outset `# ==0.1.6`
    opytional `# ==0.1.0`
    pandas `# ==2.1.3`
    seaborn `# ==0.13.0`
All images are works of the author.
If you want to evolve your company with AI, stay competitive, use for your advantage A Killer Fix for Scrunched Axes, Step-by-step.
Discover how AI can redefine your way of work. Identify Automation Opportunities: Locate key customer interaction points that can benefit from AI.
Define KPIs: Ensure your AI endeavors have measurable impacts on business outcomes.
Select an AI Solution: Choose tools that align with your needs and provide customization.
Implement Gradually: Start with a pilot, gather data, and expand AI usage judiciously.
For AI KPI management advice, connect with us at hello@itinai.com. And for continuous insights into leveraging AI, stay tuned on our Telegram t.me/itinainews or Twitter @itinaicom.
Spotlight on a Practical AI Solution:
Consider the AI Sales Bot from itinai.com/aisalesbot designed to automate customer engagement 24/7 and manage interactions across all customer journey stages.
Discover how AI can redefine your sales processes and customer engagement. Explore solutions at itinai.com.
“`
List of Useful Links:
- AI Lab in Telegram @aiscrumbot – free consultation
- A Killer Fix for Scrunched Axes, Step-by-step
- Towards Data Science – Medium
- Twitter – @itinaicom